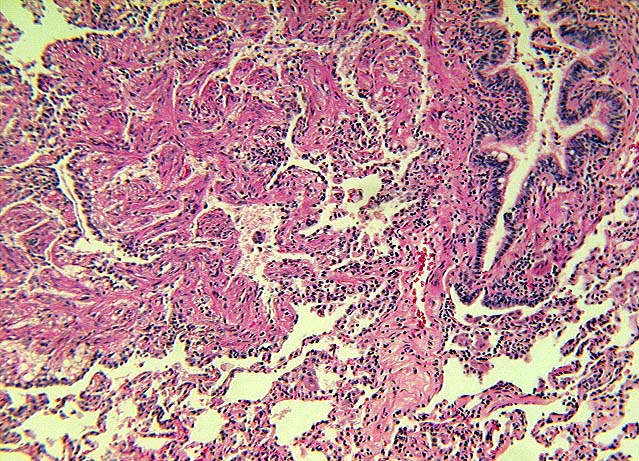
MICROSCOPIC DESCRIPTION:
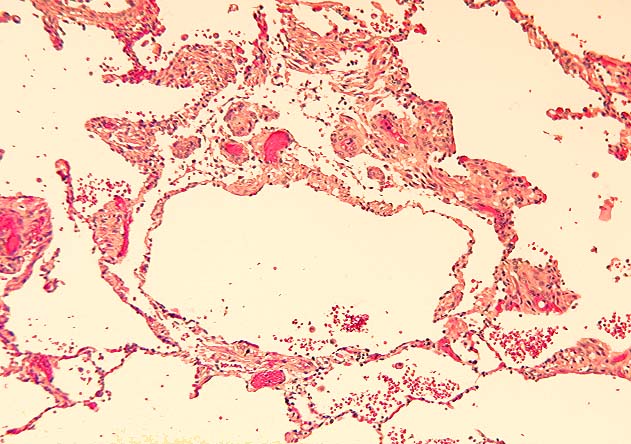
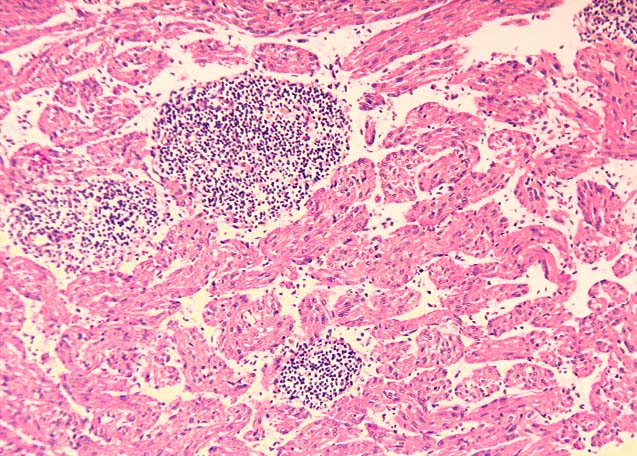
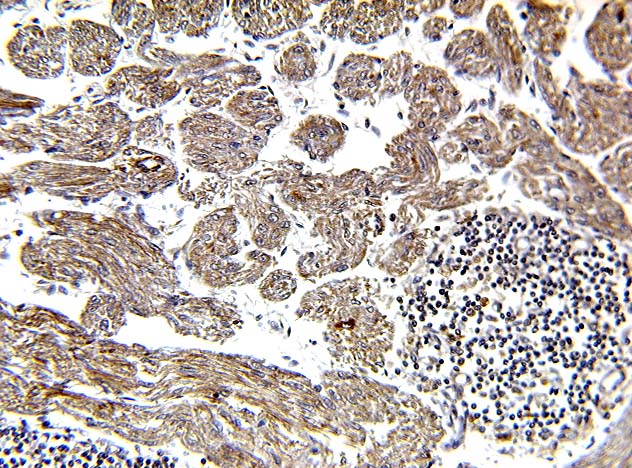
Sections of the open lung biopsy show considerable disorganization of the lung parenchyma associated with lymphocytic infiltrates, suggesting interstitial pneumonitis. However, the prominence of the interstitial smooth muscle proliferation appears disproportionate to the degree of the interstitial infiltrates (Image 01). The sections of the lungs at the autopsy confirm the presence of interstitial smooth muscle proliferation, depicting bundles of spindle shaped cells around terminal bronchiolar structures, vascular spaces and alveolar walls with cystic formations (Image 02). The enlarged retroperitoneal lymph nodes show almost total replacement of their normal architecture by smooth muscle depicting a sinusoidal architecture (Image 03).
The sections of the open lung biopsy and a representative section of the lung and retroperitoneal lymph nodes were immunostained using commercial primary antibodies for HMB-45, Muscle Specific Actin (MSA). Sections of the open lung biopsy were also tested for Estrogen-progesterone receptors (ERICA) and (PRICA).
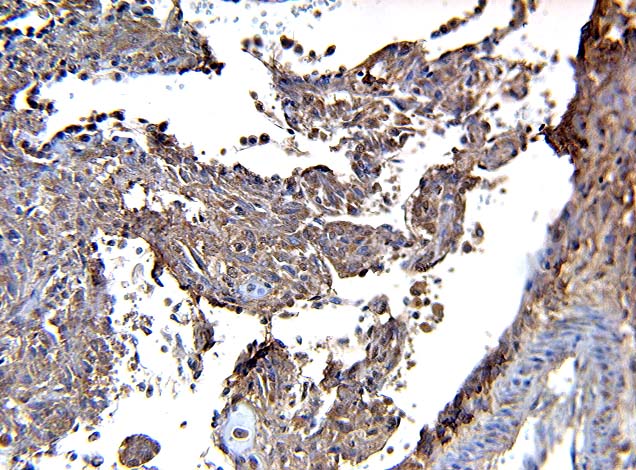
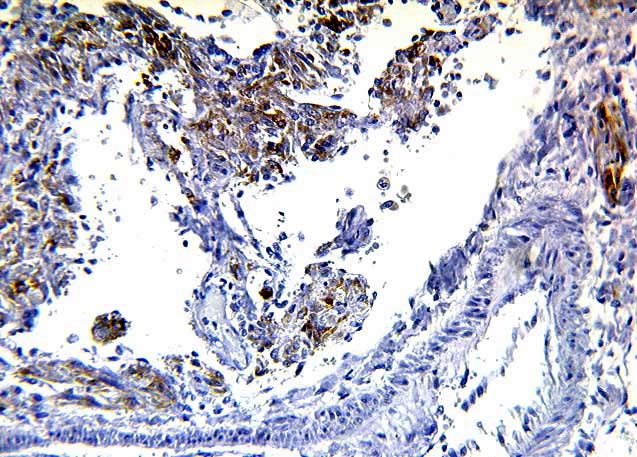
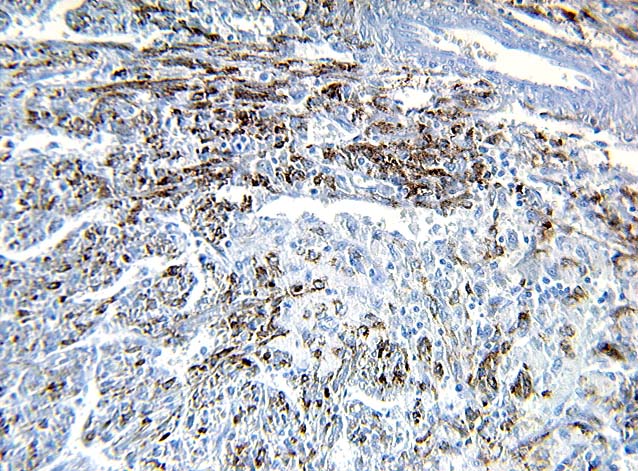
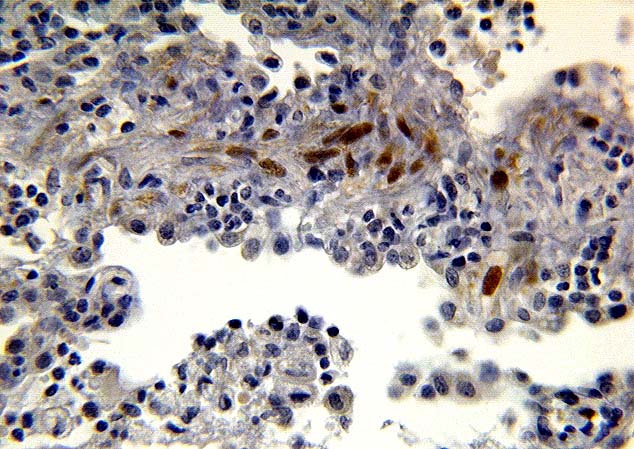
MSA is uniformly positive in the smooth muscle seen in the lungs. There is no staining difference between the normal smooth muscle and the lesional tissue (Image 04). In the lymph nodes this stain confirms the presence of smooth muscle replacing the normal architecture (Image 05). HMB-45 shows a positive population of cells intermingled within the bundles of smooth muscle in the lungs. The smooth muscle normally present in the walls of blood vessels and bronchioles are totally negative (Image 06), as well as within the retroperitoneal lymph nodes (Image 07). There is a diffuse granular appearance in the cytoplasm of the positive cells.
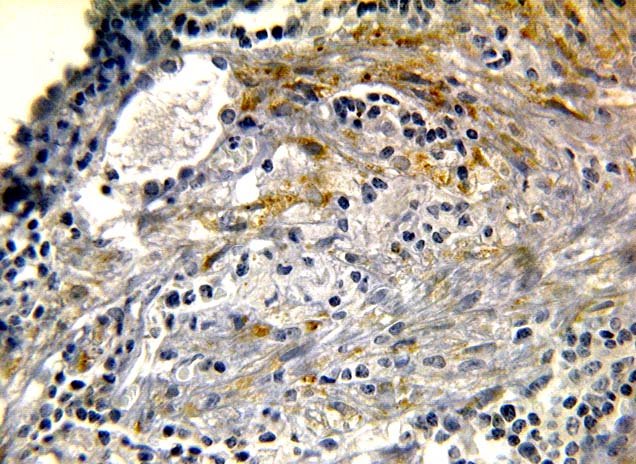
ERICA shows patchy areas of positive staining in the cytoplasm of approximately 30% of lesional cells, nuclei failed to stain (Image 08). PRICA staining reveals positivity in the cytoplasm of some cells and in the nuclei of others, totalling approximately 50% of lesional cells in a patchy distribution (Image 09).